Preparation is the most crucial element of sports broadcasting. The sports broadcaster must have information at his disposal to draw upon, either by quick reference or through memorization. Thorough preparation involves the development of spotting boards, a visual reference tool which instantly provides key information on vital statistics and information at a glance. As a play-by-play announcer, it is imperative to have the information at your fingertips when you need it. Information from the spotting boards should come from team websites, newspapers, discussions with players and coaches, game notes, stat packs, and media guides.

My current mode of preparation involves the use of a software program, developed exclusively for broadcasters, called Broadcasters Edge. This program was developed by Brian Freedman, and it supports multiple sports. I use the software with ease for my work with Merrimack College as well as with the Lowell Spinners. Within the software itself you can input rosters, schedules, individual and team statistics, as well as several areas where you can input stories, nuggets, notes, and any other kind of customizable information that you may wish to employ in the course of your broadcast. That is the beauty of the program- you can customize the information you need anyway you wish, so that in the course of a game you can find the information you need quickly and easily. You’ll know exactly where to look because YOU customized the information. It is designed to function as a normal spotting board would (see below), with the added element of typing updated information in as opposed to whiting out and replacing the info with a Sharpie colored pen. You can even import stats (if supported), this function being available at the professional level, like the NHL, MLB, NBA, and the NFL. The beauty of this program is that you can use it at any level- from high school sports up to the pros, and you don’t need an Internet connection to update or use it, except for importing the stats. There even is a feature where you can trade a player to another team! That comes in handy during college hockey season if a player transfers to another program. I’ll simply use the “trade” feature and all of his info gets transferred to his new team. There is PLENTY of room to capture all the stats, quotes, stories, and nuggets you’ll need for a broadcast.
Preparation for a broadcast involves reading everything available on the teams. It is advisable to research everything, right down to the player’s favorite foods. By the time the game starts, the goal is to know everything there is to know. Preparation involves active learning – note taking, reading, and asking questions. I make it a point to not only make use of the Internet, but also newspapers, media guides, and talking to coaches and broadcasters to supplement my knowledge.
In past years, I made use of spotting boards to prepare for my broadcasts. Many broadcasters still use the technique of building their boards by hand, and I advocate for that approach, because I did it that way for many years before Broadcasters Edge came along. The basic boards I used were created using white poster boards which are available in the arts section at most office supply stores. (I always bought mine at Staples). They come in packages of three (I bought the largest size, which is 14” x 22”) for about $3.00 a pack. I always used white boards, because it would allow me to create the board in color for easy visual identifications. Every color I used represented a code for each bit of information, which allows for easy visual recognition. I made use of Sharpie © colored markers in the course of developing my boards.
Large size spotting boards are perfect for hockey and especially football, since the rosters are expanded and there is more information to deal with. I used a smaller board for basketball, since the rosters are much smaller. I typically used a smaller board for baseball as well. A word of caution – when using spotting boards for baseball, always be prepared to update information on a daily basis.
Above you’ll find an actual board I used – it’s a hockey example here, but when you use spotting boards for other sports, obviously there are different stats to track – each sport has different stats and data. For example, in baseball, one could track home run trends, RBI trends, hitting streaks, strikeout data, and the like. Basketball may involve free throw stats, rebounding and three point stats, turnovers, etc. In football, you can track touchdowns, rushing and receiving data, field goals, first down conversion percentages, and so on. If you would like to see other samples of spotting boards I have used in other sports, please E-mail me at jleahybroadcaster@gmail.com.
Another advantage to hand constructed boards is that it helps with the retention process. Writing info down is an excellent memory aid! When I did boards for my college hockey coverage at Merrimack, I devoted one whole day to each team. I then did a third board covering general information like standings and statistical leaders. This prep process is cut in half when using Broadcasters Edge and can be incorporated and customized into the Broadcasters Edge software.
Let’s take a tour of an actual spotting board I used in a hockey game between Merrimack and Northeastern on Dec. 2-3, 2005. Click on a numbered tab for more information about each section of the board. This is the same type of information I can incorporate into the software, into customizable boxes.
Team records and leaders

Across the front of the board I list team records and leaders. The first column shows the team’s record; overall, conference, home, away, on neutral ice, in overtime, and what their current streak is. From there I list their power play (PP) efficiency and percentages, their shorthanded goals (SHG), shorthanded goals given up; penalty minutes per game (PIM/G), opposition penalty minutes per game (OPP PIM/G), and shots on goal. In the third column I list goals per period, goals per game (G/GM), opponent goals per game (OPP G/GM), shots per game (SH/GM), opponent shots per game (OPP SH/GM), and empty net goals (ENG). From there I like to list the team leaders in each category, followed by individual game highs, team game highs, and opponent game highs and lows.
Player identification

This section of the spotting board, using college hockey as an example, is quite possibly the most basic yet most important area of information. Here you will notice several bits of information: the player’s uniform number is located on the far left side of the box. Listed from top to bottom in each individual player box are basic biographical info, the player’s name (with phonetic written pronunciations if necessary), his position and year, hometown and height and weight. I then like to list the player’s stats entering the game. In the above example, I have left enough room to update the stats for the second game of a back-to back series. Also you can include where the player went to high school and/or the last team played for, which I have done here. Then I like to include the player’s career statistics against his opponent. In the above example, Andrew Linard has no career games against Merrimack College. Brian Swiniarski (# 23) has thirty career goals and seventeen assists for forty-seven points.
Anecdotal information

This particular section of the board can list miscellaneous information that will support the broadcast. From left to right, I have listed the roster breakdown by class, information on the coaches, attendance information, and information on the home arena that the team plays in. This is known as anecdotal information.
Line combinations
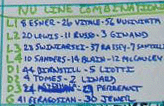
This particular section of the board, for hockey games, lists the line combinations for the team, complete with uniform numbers, which I cull from the game notes, and is filled in at the last minute, because lines can change. I usually fill this in at the rink. “L1″ represents the starting line, and then L2 through L4 the other forward lines. D1 through D3 represents the defense pairings, and ” G” represents the goaltender depth chart, listed in order. The starting goaltender is always listed first.
League rankings
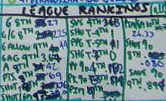
Here I like to list where the team ranks in various statistics compared to the other teams in the league. You can see that in Box 1 (far left) Northeastern ranks 8th in the league in goals (27), 8th in goals per game (G/G) with 2.25, 9th in Goals Allowed (G Allow) with 44, 9th in Goals Allowed per Game (GAG) with 3.67, 8th in assists (A) with 42, 8th in points (69) 9th in Shot Percentage (3.36) and 9th in Shots Per Game. (Shot/GM). Moving to the second column, they are 4th in saves (SVS) with 348, tied for fourth in shutouts (SHO) with 1, tied for fifth in power play goals (PPG) with 1, tied for 7th in shorthanded goals (SHG) with 0, 4th in power play percentage (PP %) at . 182, 8th in penalty killing percentage (PK%) at .179, and 9th in penalties in minutes. The third column illustrates that the Huskies are 10th in the league in Penalty Minutes per Game (PIM/GM) with 26.33, 8th in Shot % at .080%, and 9th in Save Percentage at .894. These statistics are acquired through websites and game notes.
Season Team Results
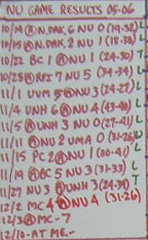
This section illustrates the game by game results of the team. You can see that the date of the game is indicated, followed by the opponent (and whether or not the game was home or away). The numbers in parentheses indicate the shots on goal ( I list the team you are covering shots first), followed by the result ( W for win, L for loss, and T for tie).
Last season’s results

I also like to talk about the prior games between the two clubs during a game. In this particular case, here are the results of the games played in the previous year between the two clubs, with date and score. You can also discuss memorable achievements in the context of reporting the scores.
Summary of last game
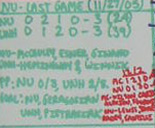
In the context of doing a game, you need to discuss past trends. This section of the board illustrates Northeastern’s last game prior to the current one (in green). You can see the box score (goals per period) followed by the shots on goal in parentheses for each team. Below the box score I have listed the goal scorers for each team, followed by power play (PP) information and then goaltenders. In the lower corner, written in red, is the box score for the game played last night between the two teams. This is edited information, updated after Game One between the teams.
All time history between teams
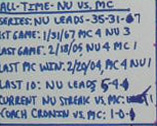
This section documents the all time history between the teams involved. I am big on history, as it puts the game into proper perspective. The information here illustrates the all time record ( Northeastern leads the series, 35 wins, 31 losses and 7 ties). The first game ever between the two teams was on January 31, 1967, with Merrimack winning 4-3. Then I list the most recent game between the two teams. (Northeastern won 4-1). Also listed are the last Merrimack win (4-1), and then the record over the last ten games played between the teams (Northeastern leads 5-4-1). Finally, we talk about Northeastern’s current streak against Merrimack College, and the coach’s record against Merrimack.
Additional anecdotal information

This particular part of the board documents the scoring totals for the team, broken down by class. This is another example of reporting on current trends. In this example, the senior class has accounted for three goals and four assists for seven points. The junior class has scored seven goals along with eleven assists for eighteen points. The sophomore class has four goals and eight assists for twelve points, while the freshman have accounted for thirteen goals and nineteen assists for thirty two points. The totals are summarized at the end. These totals are updated for game two of the home and home series, including the totals from Game.
Coaches information
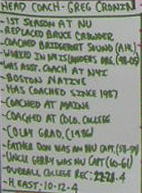
This section goes into detail about the coach of the team, talking about his history and accomplishments. Here we have more anecdotal information which fills in the blanks for the listener. Always ask the question, ” If I was a listener at home, what would I want to know about ? ” This section talks about Coach Cronin and his time at the school, where he has coached before, whom he replaced, and assorted records at his various coaching locations.
Defense Statistics

This section contains miscellaneous statistical information, which in this case is the team’s record when certain defensemen are paired together. For example, when Birnstill and Liotti are paired together on defense, the Huskies are 1-8-2. ( one win, eight losses, and two ties). The depth of statistical information that a broadcaster goes into is a matter of personal taste. I love anecdotal information and trivia because it supports the play by play. This information is acquired through game notes and team websites, which in this case are very comprehensive at the college level. The SID’s (sports information directors) provide this information and are there to assist with questions for the media.
” Lasts ” information
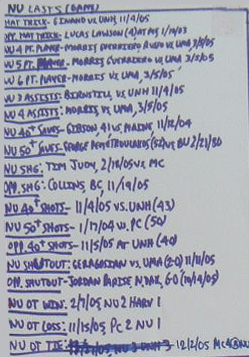
Here is a section of the board that represents what I like to call “lasts.” It talks about the last time a particular event has happened. This historical perspective is useful when a unique event happens in a game, like, in hockey, a penalty shot , for example. Here you can see I list the last time an NU player scored a hat trick (Ginand, vs. UNH, 11/4/05); the last time an opponent scored a hat trick; the last time an NU player scored four, five, and six points in a game; the last time a goalie made 40 and 50 saves in a game; the last NU shorthanded goal, the last time an opponent scored a shorthanded goal; the last time NU had 40 and 50 or more shots in a game, the last time an opponent had 40 or 50 shots in a game, the last shutout for and against, and the last overtime win, loss , and tie. This information is provided courtesy of game notes, which are listed on the team website.
Situational Statistics
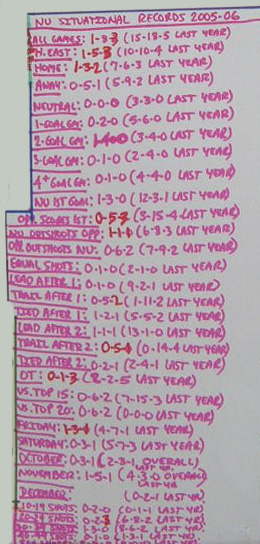
Situational records are very important in play by play because many situations occur in a game and you have to put them in context. Here are the situational records of Northeastern as displayed on the board. The records are reflective of the team’s records in all different situations. This board illustrates their overall record, conference record, home and away records, record on neutral ice; record in games decided by one, two, three, and four or more goals; record when NU scores the first goal, and when the opponent scores first; record when they outshoot their opponent and are outshot by their opponent and when the shots are equal, their record when they are leading, trailing, or are tied after the first and second period. It also shows their record in overtime, their record against a team ranked in the top 15 and the top 20; their record on Fridays and Saturdays; monthly records, and records with a certain number of shots on goal.
Specific situational statistics
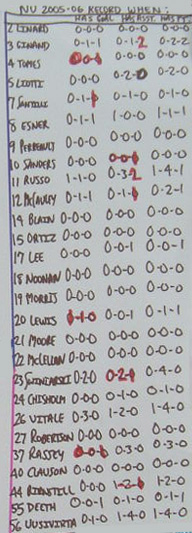
This is another area of situational stats that documents the team’s record when each particular player scores, assists on a goal, and registers a point in a game. For example, the Huskies are 0-1-2 when Ginand has an assist in a game. These statistics are updated prior to game 2.
Situational Goaltender statistics
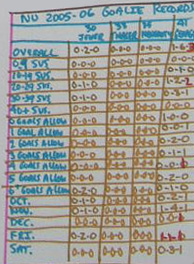
This section shows goaltender records. It shows the team’s record when each particular goalie plays, followed by the team’s record when each goaltender makes a particular number of saves. Then it breaks down the team’s record based on the basis of number of goals allowed , followed by goalie records per month and day of the week . For example, The Huskies record when Jewer plays is 0-2-0. They are 0-3-1 when Geragosian makes 30 to 39 saves. They are 1-0-0 when Thaler allows no goals. The chart also shows that Jewer was 0-1-0 in October and Geragosian is 0-3-1 on Saturdays.
Line charts and statistical information
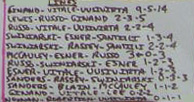
This section shows the goals, assists, and points garnered by each line, or group, of players. In the first example, the line of Ginand, Vitale, and Uusivirta have combined for nine goals and five assists for fourteen points.


